
New state funds bolster per-student spending
By Bob Pieper for Chronicle Media — January 15, 2020
Venice Elementary School is part of the Community Unit School District 3, which has the highest per-student spending in the Metro East region. (Photo courtesy of Venice CUSD 3)
Per-student spending in many of Metro East’s poorest school districts now exceeds that in many of the region’s most affluent districts, according to data from the Illinois State Board of Education (ISBE).
Annual per-student spending in area school districts ranges from $8,000 in Smithton CCSD 130 to $27,000 in Venice CUSD 3, according to the ISBE.
State and local officials credit Illinois’ new Evidence-Based Funding (EBF) program — designed to provide additional state funding to school districts in economically disadvantaged areas.
The revised state school funding program came, in part, as a result of lobbying by a group of Southwestern Illinois school districts.
School districts in economically depressed areas often have limited ability to raise revenues locally, the group noted. They may have larger than average numbers of children in poverty or children with special needs, who necessitate increased per-student spending.
Average annual per-student spending data, at the school level, was included for the first time on 2019 Illinois Report Cards, released Oct. 30, by the ISBE.
The ISBE Report Cards do not include average per-student data for school districts across the state nor historical spending data for local school districts.
Current per-student spending data for school districts across the nation is scheduled to be released by the U.S. Census Bureau, as part of its 2020 Annual Survey of School System Finances, in May.
However, even without such context, the effect of the new funding system can be easily seen, local educators say.
“Exploring this new level of financial data in context can deepen understanding of equity in Illinois and of the relationships between spending, student characteristics, and student outcomes,” according to the ISBE press release announcing the Report Cards.
Per student school district spending can be influenced by several factors, but the biggest remains property tax revenues – that traditional source of most public-school funding, according to the widely read public administration trade journal, Governing.
Higher income areas with increasing property values tend to provide their school districts with tax revenues not available in poorer areas, a Governing analysis of school funding notes.
Other factors can include student transportation or administrative cost, the magazine notes.
However, revenue – particularly property tax revenue – remains the primary determinants in per-student spending levels, confirms Susan Sarfaty, the Regional Superintendent of Schools for St. Clair County.
“School districts spend according to the funds they have available,” Sarfaty observes.
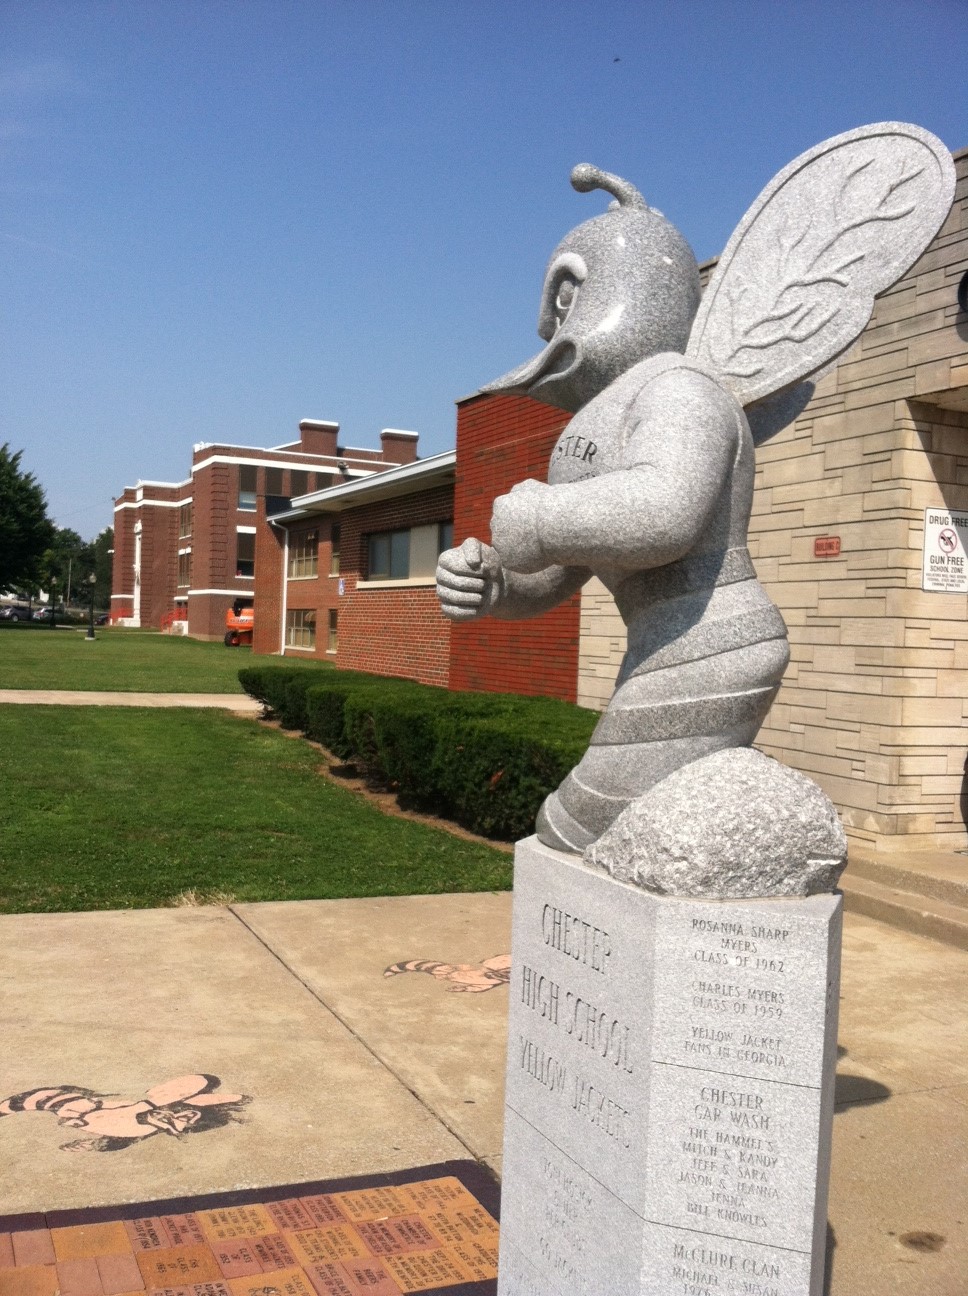
Chester High School, 1901 Swanwick St., Chester, is part of Chester Community Unit School District 139, which spends $8,000 per student, according to the 2019 Illinois State Board of Education report card. (Photo courtesy of Chester CUSD 139)
State and federal grants can in some cases help districts to shore up income and increase per student spending, Sarfaty adds.
East St. Louis School District 189’s Bush Elementary, in 2016, was awarded a $4.8 million federal School Improvement Grant (SIG), by the ISBE. Two other East St. Louis schools — Lincoln Middle and Mason-Clark Middle — have also received SIG grants.
ISBE officials suggest the new evidence-based funding (EBF) program is already showing results.
Graduation rates, college preparatory course participation, and other academic indicators were up last year, the ISBE notes. Career program enrollment also increased.
The new funding has resulted in the hiring of additional teachers, social workers, and counselors; reduction in class sizes; and investment in professional development, in numerous school districts, according to an ISBE statement. Teacher diversity, retention, and attendance, as well as the total number of teachers in the state, showed slight upticks in 2019.
In a 2018 analysis, governing placed Illinois’ school spending coefficient of variation at 24.7; the third highest in the nation.
District per-student spending, as reported on the ISBE Report Cards, is determined by district superintends based on a complex formula.
The ISBE Report Cards reflect operating spending per pupil, which includes all school district costs for overall operations, including Instructional Spending, but excluding summer school, adult education, capital expenditures, and long-term debt payments.
Instructional spending per pupil —which includes only the activities directly dealing with the teaching of students or the interaction between teachers and students — is reported separately online by the ISBE in detailed spreadsheets.
Following is the ISBE Report Card per student spending data for school districts in Madison, Monroe and St. Clair counties. The number of schools in each district is provided in parentheses. Data for school districts based in Randolph County, which may serve students in or near Monroe or St. Clair counties is included.
By the numbers
St. Clair County
Belle Valley SD 119 (1) – $9,800.
Belleville SD 118 (11) – $12,000.
Belleville Township HSD 201 (2) – $13,000.
Brooklyn UD 188 (3) – $15,000.
Cahokia CUSD 187 (10) – $20,000
Central SD 104 (O’Fallon) (2) – $10,000.
Dupo CUSD 196 (3) – $9,500.
East St. Louis SD 189 (10) – $16,000.
Freeburg CCSD 70 (2) – $9,700.
Freeburg CHSD 77 (1) – $11,000.
Grant CCSD 110 (2) – $13,000.
Harmony Emge SD 175 (3) – $11,000.
High Mount SD 116 (1) – $12,000.
Lebanon CUSD 9 (2) – $11,000.
Marissa CUSD 40 (2) – $11,000.
Mascoutah CUD 19 (5) — $10,000.
Millstadt CCSD 160 (2) – $8,900.
New Athens CUSD 60 (3) – $10,000.
O’ Fallon CCSD 90 (7) – $8,400.
O’ Fallon Township HSD 203 (1) – $11,000
Pontiac-W. Holliday SD 105 (2) – $10,000.
Shiloh Village SD 85 (2) – $9,400.
Signal Hill SD 181 (1) – $11,000.
Smithton CCSD 130 (1) – $8,000.
St. Libory Consolidated SD 30 (1) – $12,000.
Whiteside SD 115 (2) – $9,000.
Wolf Branch SD 113 (2) – $10,000.
Madison County
Alton CUSD 11 (10) – $10,000.
Bethalto CUSD 8 (5) – $9,300.
Collinsville CUSD 10 (11) – $10,000.
East Alton SD 13 (3) – $12,000.
East Alton-Wood River CHSD 14 (1) – $13,000.
Edwardsville CUSD 7 (13) – $8,000.
Granite City CUSD 9 (8) – $11,000.
Highland CUSD 5 (6) – $9,000.
Madison CUSD 12 (3) – $15,000.
Roxana CUSD 1 (4) – $13,000.
Triad CUSD 2 (6) – $8,600.
Venice CUSD 3 (1) – $27,000.
Wood River-Hartford ESD 15 (3) – $11,000.
Monroe County
Columbia CUSD 4 (4) — $8,600.
Valmeyer CUSD 3 (3) – $11,000.
Waterloo CUSD 5 (5) — $8,700.
Randolph County
Chester CUSD 139 (2) – $8,000
Coulterville USD 1 (3) – $10,000.
Prairie Du Rocher CCSD 134 (1) – $11,000.
Red Bud CUSD (2) — $9,800.
Sparta CUSD 140 (3) – $10,000.
Steeleville CUSD 138 (2) – $9,200.
For additional data, see www.isbe.net/reportcard.
Trending News
 With scant notice, Rockford hospital ...Residents on Rockford’s west side are feeling abandoned and betrayed after Javon ...
 State ends fiscal year with ...Despite uncertainty over the economy and federal funding during the second half ...
 Highland Park parade ‘full of ...Highland Park’s Fourth of July events included a parade which stepped off ...
 Three men shot – one ...Three men were shot – one fatally -- Saturday afternoon on Chicago's ...